Showing posts with label statistics. Show all posts

Wednesday, June 29, 2011

Barbie Bungee [now with pictures]

So, what do a class full of AP-Statistics teachers do during these workshops, you may wonder.....

We turn Barbie into a thrill-ride seeker! Statistical (and Algebraic) methods were used to determine the relationship between the number of rubberbands used in relation to the distance Barbie bungee'd; all initial data was collected in the classroom, using a maximum of 5 rubberbands, and of course....a Barbie. Some "statistics-magic" was performed to find the optimal relationship (equation) in order to predict for the ULTIMATE THRILL RIDE EVENT: The BIG plunge of 199 inches (the distance measured in the hall's stairwell).

My team did not kill Barbie, (yay!) and had her come within a foot of the floor. However, one team had their Barbie's hair actually brush the floor, but never hitting her head, and therefore were deemed Most Thrilling by Barbie.

To wrap up the project, we held a Barbie-n-Friends Bungee Party :0)

Yeah...I can see this being a definite lesson to use with my AP-Stats kids; I THINK they'd be mature enough to play with Barbie for a day :0)

Okay....onward to Day 3.
Happy Wednesday.

{{pictures from phone; hence the poor quality}}

Friday, January 7, 2011

Squealing with delight!

Because I have a hard time publishing posts without graphics, I found one of my favorite "upper-level" math cartoons that I share with my students :0) Maybe it's only funny for us geeky mathematicians and nerdy scientific minds???? ;0)

I AM DONE PREPPING FOR NEXT WEEK!!!!!

Yup---I got home at 4:00 today with girls in tow; they sat down to watch a movie (SandLot2) and I parked my butt at the kitchen table. Out came the Statistics books and away I went! Test written. Lessons prepped, for the most part.

So now....the weekend is MINE MINE MINE, GUILT FREE......

**happy, heavenly sigh**

;0)
Happy Friday Night!

Tuesday, December 7, 2010

What I'm up to...

SO Angela is Tiny Tuesday'ing away....
Amanda is enjoying some tea and trying to make the best of her weather...
Jill is working on a spectacular Radiating Star quilt for granny

Me?.....

I'm TRYING not to feel dumb....

I just taught myself a lesson on Confidence Intervals....


ie: If I take a sample (n=1077) of young women whose mean quantitative score (x-bar) is 275 on a national NAEP test and knowing the population standard deviation (sigma) = 60....

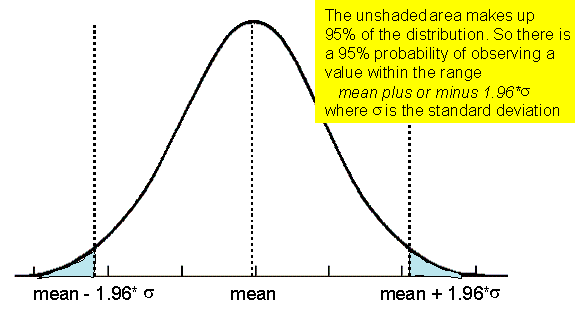
A 95% confidence interval has me using a critical value (z*) of 1.96 and sample mean standard deviation of 60/squ rt(1077)
Therefore, I can be 95% confident that the true population parameter (the population mean) is between:

275 +- 1.96(60/sqr rt (1077))
which equates to :
271.4166 to 278.5834

and that my margin of error is 1.96(60/squ rt (1077) = 3.5834


In layman's terms

If I were bored and went out asking 1077 young ladies how they scored on their NAEP tests, I can, with 95% confidence say that, the average score of the 1077 ladies will fall between 271.4166 and 278.5834. OR that the average will be 275 +- 3.5834 points.


{{{{I think}}}}